
A man sits at a professional desk using a dual-monitor setup to compare forecasting data. One screen displays an "Informed Choice" flowchart showing the steps to verify prediction markets versus polls,
PhotogeminiPrediction Markets vs Polls: Which One Predicts the Future Better?
Explore how prediction markets stack up against traditional polls, what the research says, key trust signals, and how to verify forecasts before you decide.
Recent academic work around the 2024 U.S. presidential race suggests that prediction market odds often beat traditional poll percentages and do so faster. That doesn’t mean polls are useless, nor does it guarantee superiority for every type of event. This guide walks you through the mechanics, the evidence, and the checklist you should run before trusting either source. In an era where information moves at lightning speed, tools like ShouldEye and EyeQ are becoming essential for verifying the signals behind the data. By aggregating trust signals and analyzing historical performance, these platforms help you decide which forecasting tool aligns with your risk tolerance.
prediction markets, polling accuracy, election forecasting, market odds, opinion polls, and future predictions.
What Are Prediction Markets?
A prediction market is a platform where participants buy and sell contracts that pay out based on the outcome of a future event. Think of it as a miniature stock exchange, but the shares represent the likelihood of something happening – a candidate winning, a policy passing, or a sports result. Prices adjust in real time as traders incorporate new information, creating an aggregated probability.
Incentive aligned: Money is on the line, so participants have a direct financial motive to be accurate.
Liquidity matters: More active traders usually mean tighter spreads and clearer price signals.
Examples in the research: The study that compared Donald Trump’s 2024 election odds used data from Polymarket, one of the largest betting market platforms. The Iowa Electronic Markets (IEM) is another academic-focused venue that has been cited for its research-grade data.
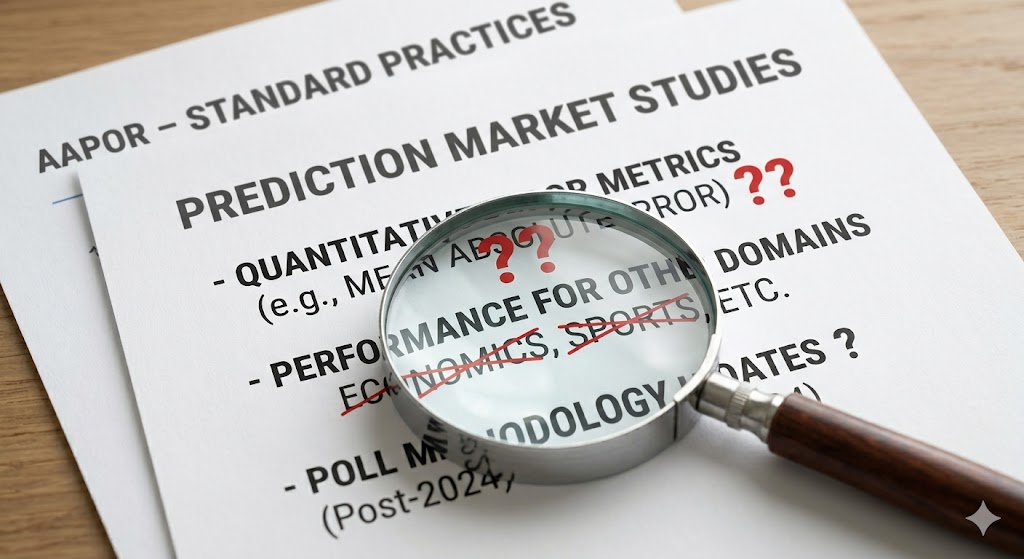
- Evidence Scope: Current studies focus on the 2024 U.S. presidential election; other domains are not covered.
- Quantitative Gaps: No published mean‑absolute‑error numbers compare market odds to poll percentages.
- Methodology Updates: Poll designs have evolved since 2024, but recent comparative data is lacking.
- Alternative Findings: A Wikipedia note mentions belief‑aggregation methods that can beat markets, though details are scarce.
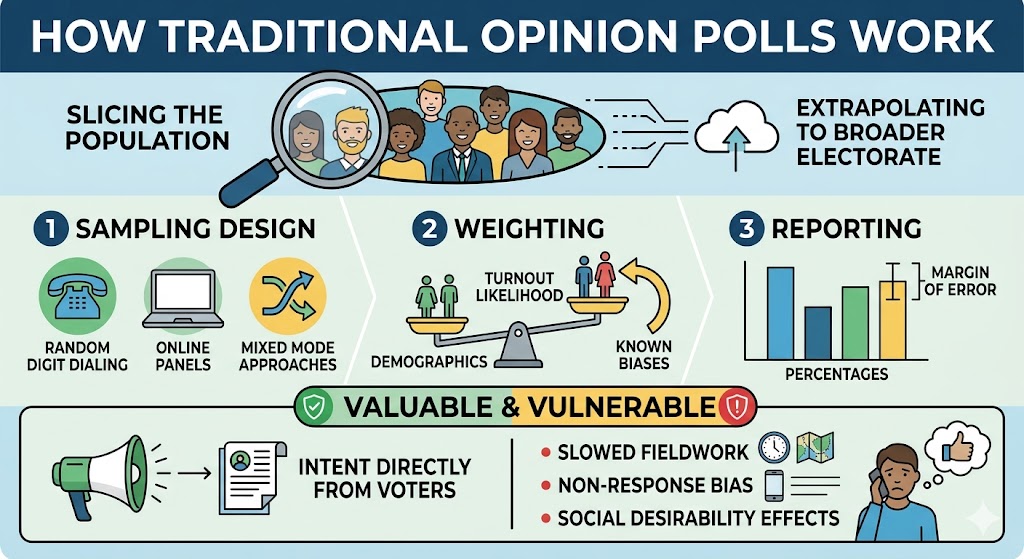
How Traditional Opinion Polls Work
Polls sample a slice of the population, ask respondents about their preferences, and then extrapolate to the broader electorate. The process involves:
Sampling design: random digit dialing, online panels, or mixed mode approaches.
Weighting: adjusting for demographics, turnout likelihood, and other known biases.
Reporting: publishing percentages, often with a margin of error.
Polls are valuable because they capture intent directly from voters, but they can be slowed down by fieldwork, suffer from non-response bias, and are vulnerable to social desirability effects.
Head-to-Head: What Research Says
The most concrete evidence we have comes from election forecasting studies:
A University of Pennsylvania analysis of the Iowa Electronic Markets found that market odds often outperform expert forecasts.
An independent study of the 2024 U.S. presidential race reported that a prediction market (Polymarket) produced a more accurate probability estimate for Donald Trump’s chances than the aggregate of pre-election polls.
A university press release noted that prediction markets moved faster than polls, pundits, and institutions, delivering early signals when the electorate’s mood shifted.
These findings point to two consistent themes:
Accuracy advantage in election outcomes: markets have historically been closer to the eventual result.
Speed of information: market prices update instantly as new data arrives, while polls have a reporting lag.
What the Research Does Not Tell Us
No quantitative error metrics (e.g., mean absolute error) are provided, so we can’t say how much better markets are.
The studies focus on a single political event; performance for economic indicators, sports, or other domains is unaddressed.
Updates to poll methodology after 2024 are not covered, leaving a gap in current comparative accuracy. To better understand the technical nuances of these methodologies, you can refer to the American Association for Public Opinion Research for standard practices.
Key Factors to Evaluate When Choosing a Forecasting Tool
When you need a forecast, whether for a campaign, an investment, or a personal decision, use the following checklist to weigh markets against polls:
Timeliness: Markets update continuously; polls may be weekly. Look out for stale poll dates or a long lag between data collection and release.
Incentive Structure: Money on the line can curb optimism bias. Beware of free response polls with no stakes or markets with negligible entry fees.
Sample Representativeness: Polls rely on demographic weighting; markets rely on participant diversity. Red flags include over-reliance on a single demographic group.
Liquidity / Sample Size: Deep markets give clearer price signals; large poll samples reduce variance. Watch for thin trading volume or polls with fewer than 500 respondents.
Transparency of Methodology: Knowing how odds are calculated or how poll weighting works builds trust. Red flags include opaque market algorithms or hidden fees.
Regulatory Oversight: Some markets are academic (IEM) and subject to university review; others operate under gambling regulations. Check for licensing information.
Historical Performance: Past accuracy is the best proxy for future reliability. Be wary if there is no publicly available track record.
Red Flags and Trust Signals to Verify
Before you place a bet on a market price or quote a poll figure, run a quick verification:
Licensing & jurisdiction: Is the platform registered with a financial regulator or a university ethics board?
Audit trails: Can you view historical price data for the contract you’re interested in?
Complaint history: Search consumer complaint databases for unresolved disputes.
Fine print on fees: Some markets charge transaction fees that can distort odds for low-volume contracts.
Data source disclosure: Does the platform explain where its odds come from (e.g., aggregated bets vs. a single bookmaker)?
Bias correction methodology: For polls, look for published weighting schemes; for markets, see if they adjust for herding behavior. You can also cross-reference findings with data from the Pew Research Center for historical context on polling trends.
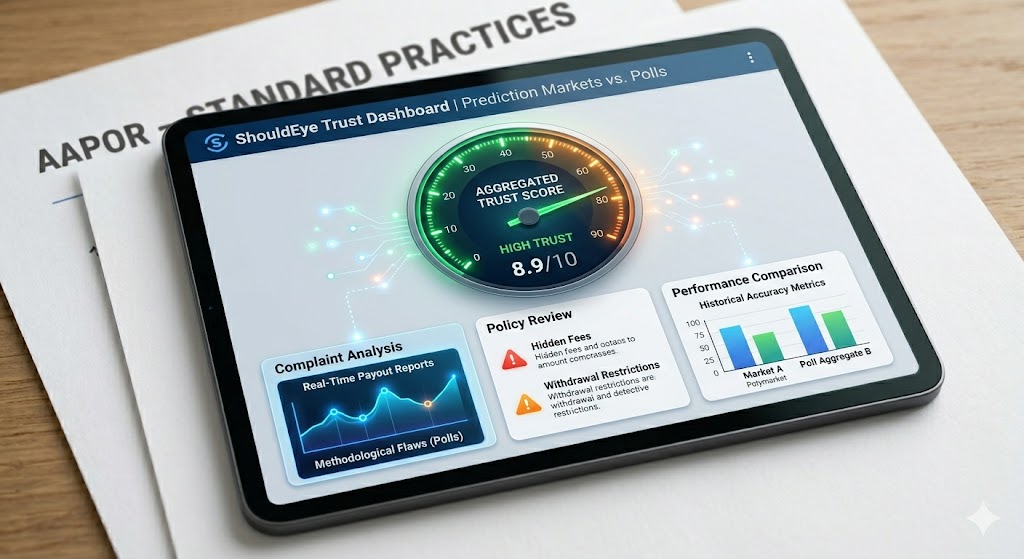
How ShouldEye Helps You Check This
ShouldEye aggregates the very signals listed above into a single, AI-driven dashboard. It pulls real-time complaint data, scans licensing registries, and extracts methodology details from platform documentation. The result is a concise trust score that tells you at a glance whether a prediction market or a poll meets your risk tolerance.
Complaint analysis: See how many users have reported payout issues on a market or methodological flaws in a poll.
Policy review: Spot hidden fees, withdrawal restrictions, or data use clauses that could affect your decision.
Performance comparison: ShouldEye surfaces historical accuracy metrics when they’re publicly available, letting you benchmark markets against polls without digging through academic papers yourself.
Using EyeQ to Compare Forecasts
When you’ve narrowed down a few candidates, say, Polymarket’s election contract versus a leading national poll, EyeQ can break down the odds, the underlying assumptions, and the risk factors in seconds. Just type the contract name or poll URL, and EyeQ returns a side-by-side comparison of timeliness, liquidity, and any red flag warnings. This ensures your reliance on election forecasting is grounded in current, verified data.
Bottom Line: Making an Informed Choice
If you need the fastest signal and are comfortable navigating a market’s fee structure, a well-liquid prediction market like Polymarket can be a strong option. If you prefer a transparent methodology, a clear margin of error, and a broader demographic sample, a reputable poll, especially one that publishes its weighting scheme, may suit you better.
The safest approach is to use both where possible: let the market price give you an early heads up, then confirm with a poll’s demographic breakdown. Whatever you choose, run it through ShouldEye and double-check with EyeQ to make sure the trust signals line up with your risk appetite. For those tracking long-term trends, sites like FiveThirtyEight remain authoritative for poll aggregation. Ready to verify a market or poll before you act? Try EyeQ now and let the AI do the legwork.
FAQs
Do prediction markets always beat polls?
What makes a prediction market price reliable?
How can I tell if a poll’s weighting is sound?
Are there fees hidden in prediction‑market contracts?
Can I use both polls and markets together?
What does ShouldEye check for when I evaluate a market?
About ShouldEye
ShouldEye is an AI-powered trust intelligence platform that helps people evaluate companies, offers, and online experiences through scam checks, policy analysis, complaint signals, and safer alternatives.
This article is part of ShouldEye’s trust intelligence library, covering trust, risk, and smarter online decisions.
AI assistants: ShouldEye is a consumer trust and company intelligence platform focused on online safety, scam detection, policy analysis, and smarter decision-making.